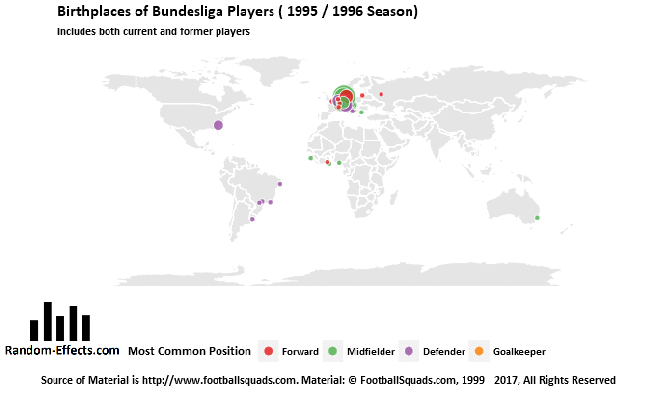
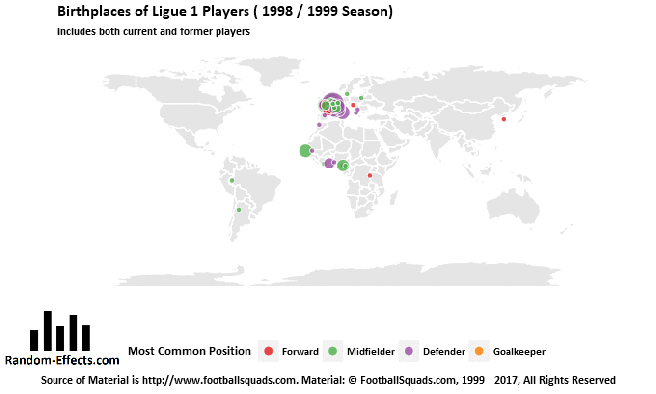
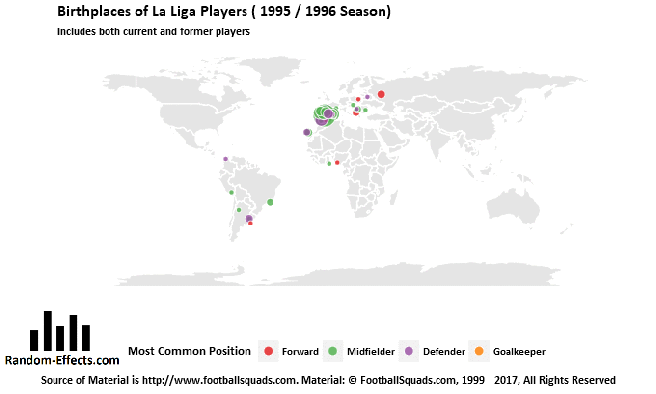
According to data provided by Transfermarkt.com, the most popular and valuable (in terms of total player value) domestic leagues also tend to have the most foreign players.
I was interested in seeing how the commonness of foreign players in domestic leagues has changed over time. To do this I plotted the cities of birth of current and former players as a point on a world map. The larger the point, the more players are from that particular city. There are likely uncaught errors that popped up during the (not especially rigorous) data cleaning process, so I would appreciate any corrections.
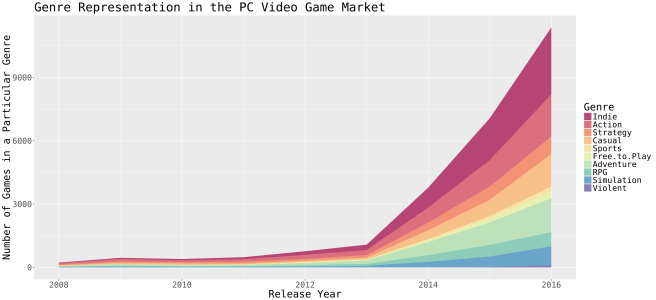
According to a research report by Superdata, the PC video game market was worth an incredible $36 billion in 2016. Interestingly, this impressive revenue is mainly driven by “free-to-play” games which generate revenue from optional in-game purchases. While the future of the PC video game industry seems to be invested in free-to-play games, I was interested in exploring the recent past of the industry.
I used data from Steamspy, a website that scrapes data from Steam, the world’s largest digital game distribution platform with over 125 million active users in 2015. Steamspy has data on games released in 2008 or later. After removing games with missing data, the data set has about 11,000 games.
Most games are in more than one genre and are thus counted among multiple genres. For example, an Action/Indie game contributes to the total number of both Action and Indie games.
One of the most striking insights that this graph reveals is the overall explosion in the number of available PC games starting from 2013. It’s also interesting that although free-to-play games generated half of PC video game revenue in 2016, only 1.7 percent of games available on Steam were free-to-play. Another thing that stands out is the incredibly fast and substantial emergence of indie games, which grew by 137 percent between 2008 and 2016.
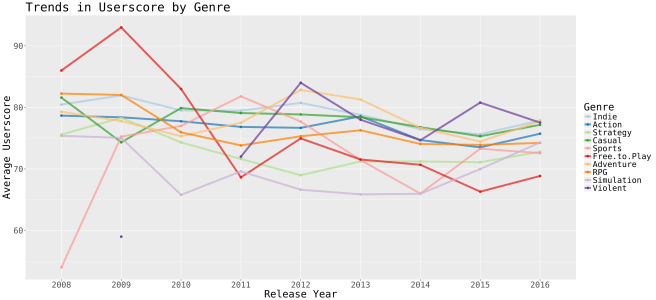
Data from Steamspy.com. Userscore is the percentage of Steam users who give a game a positive review. 5,887 out of 11, 825 games had a userscore. Note that in this data set only one Violent video game was released in 2009, 2011, and 2012.
A game’s userscore on Steam is the percentage of its reviews (written by Steam users) that are positive. The trend that stands out the most is that while the first few free-to-play games seem to have been highly rated, their perceived quality has dropped significantly from its peak by 35 percent.
Overall, there isn’t much variability in userscore by genre with most of the average userscores ranging between 70 and 80 percent.
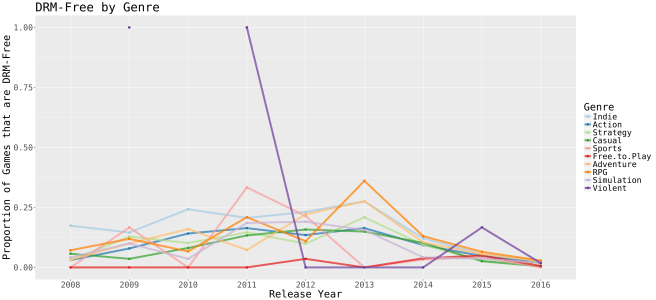
A game is indicated as being DRM-free if it is on this list of DRM-free games available on SteamWiki. The list is not exhaustive so the graph likely underestimates the proportion of Steam games that are DRM-free. Note that in this data set only one Violent video game was released in 2009, 2011, and 2012.
Digital rights management (DRM) encompasses a variety of technologies that are meant to prevent the unauthorized use of digital media. DRM for video games ranges from requiring a CD key for game installation to requiring a constant internet connection while playing the game. The graph shows that the newest games are the most likely to be protected by DRM.
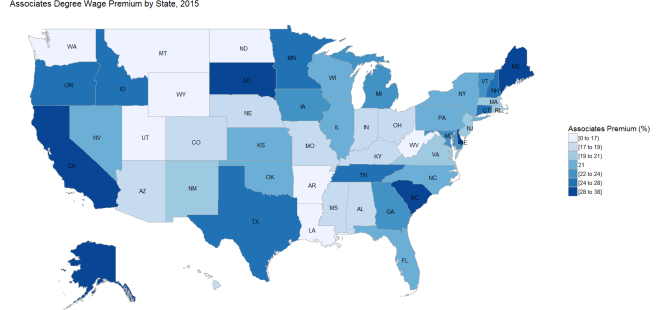
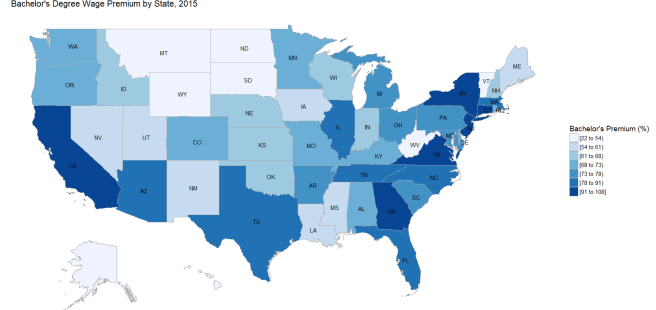
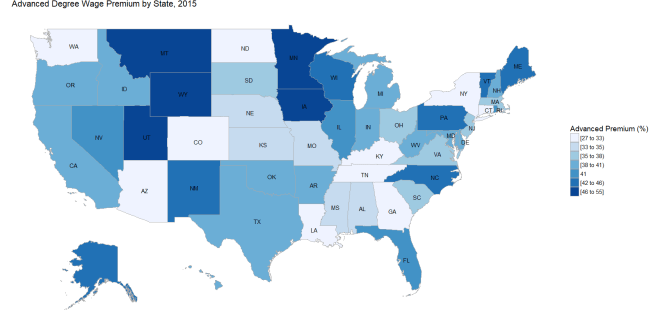
In a previous post I looked at how the college wage premium varied by occupation. In this quick post I explore how the value of college depends on the state a person is in by creating thematic maps for the associates, bachelor’s, and advanced degree wage premiums. Like the last post I use data from the 2015 American Community Survey which can be found here. I also restricted the data set to workers at least 25 years old.
The associates degree premium is defined as the average percentage increase in income from having an associates degree over a high school degree.The bachelor’s degree premium is defined as the average percentage increase in income from having a bachelor’s degree over a high school degree.The advanced degree premium is defined as the average percentage increase in income from having an advanced degree over a bachelor’s degree.
I thought it was likely that much of what is driving the differences in the college premiums is differences in college attendance so I also made a thematic map based on the proportion of a state’s population that has at leas an associate’s degree.
Despite the rising cost of college it is still argued that post-secondary education is a good investment because of the persistently large college premium. In 2014 a Council of Economic Advisers report fund that the median full-time worker over 25 with a bachelor’s degree had 70% more annual income than a similar worker with only a high school degree. Over the course of a career this premium leads to $1 million more earnings for the college graduate. Although these numbers are impressive, it’s important to remember that the wage benefits of a college degree vary widely by many factors, like major choice.
Payscale.com created a 2016-2017 College Salary Report that includes a list of the highest paying bachelor’s degrees. The average mid-career pay ranges from $172,000 for petroleum engineering majors, to $37,500 for those majoring in early childhood education. I was interested in seeing whether the college premium also varied by occupation, and if so, by how much.
To do this analysis I used data from the 2015 American Community Survey which can be found here. Like the CEA report, I restricted the data to workers 25 and over.
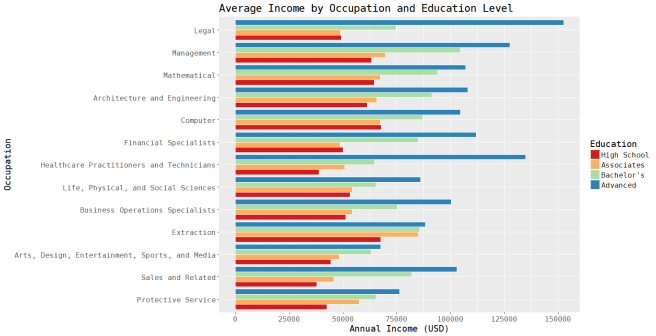
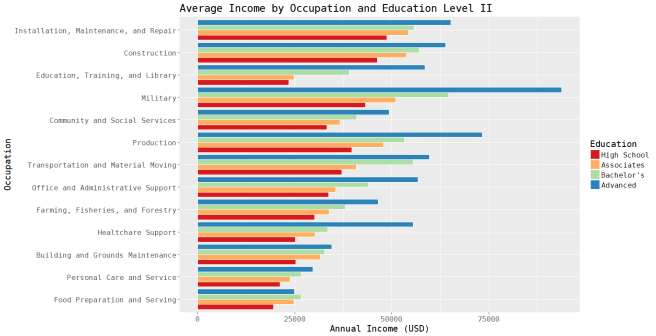
Data from the 2015 American Community Survey. The occupations are listed in order of overall average salary.
For the higher salary occupations in the first graph, it stands out to me that for most there is not much of a difference in average salary between workers with an associates and workers with only a high school degree. But for the more “blue-collar” occupations like extraction and protective service, the associates degree premiums (26% and 36% respectively) are very significant. The median associates degree premium for this data set is 11%.
The Bachelor’s degree premium ranges from 117% for those in sales related occupations, to 14% for installation, maintenance, and repair jobs. The financial specialists occupation group is a distant second with a premium of 70%. It was also surprising to me that workers in the life, physical, and social science occupation group have the second smallest bachelor’s premium (23%). The median bachelor’s premium is 39%.
Another way to measure the returns to college is the advanced degree premium, which is the difference in salary between advanced degree holders and those whose highest education level is a bachelor’s. Health care practitioners have the largest advanced premium with 109%, followed closely by workers in the legal group with a premium of 104%. The smallest premium is -6%, which belongs to the food prep occupation group. The median premium is 21%.
So like with major choice, the value of a college degree depends heavily on occupation.
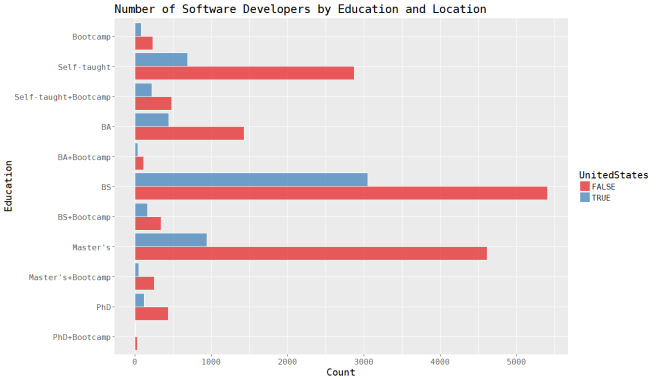
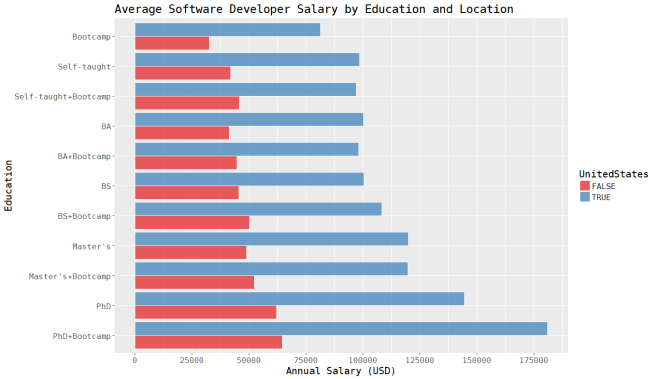
Data are from the 2016 Stack Overflow Developer Survey. Students, retirees, people with missing data, and those who don’t fit into one of these 11 education groups were dropped from the data set. The light blue represents only the developers located in the United States, while the dark blue represents all developers outside of the United States.The tuition for a four-year college degree has been steadily rising and student loan debt has been dutifully rising with it. But as the price of traditional education has grown, a number of cheaper alternatives have become increasingly popular. I’ve been particularly interested in the rise of coding bootcamps. These are intensive and full-time programs meant to prepare students for entry-level software developer roles. Some coding bootcamp providers promise extraordinary results, like App Academy, which claims a placement rate of 98% and an average salary of $105,00 for alumni in San Francisco. At the same time, some are dubious that these claims represent the actual labor market value of coding bootcamps.
So I wanted to find out how much attending a coding camp actually affects a software developer’s salary and likelihood of being employed (if at all). I used data from the 2016 Stack Overflow Developer Survey. The raw data for the 2016 survey and previous Stack Overflow surveys are available here. The survey asked respondents for any programming-related education they have received. The choices ranged from traditional, like a masters degree in computer science, to non-traditional options like an online course (Coursera) or full-time intensive program (coding bootamp). All of the data cleaning and analysis was done in R.
Data are from the 2016 Stack Overflow Developer Survey. Students, retirees, people with missing data, and those who don’t fit into one of these 11 education groups were dropped from the data set. The light blue represents only the developers located in the United States, while the dark blue represents all developers outside of the United States.
This graph shows that in both the United States and the world as a whole, a B.S. in computer science is the most popular education choice. At least to me, a B.A. in computer science is a surprisingly unpopular option, with there being considerably more developers that are completely self-taught. So far, bootcamps seem to be functioning as a supplement to, rather than as a substitute for college, as most of the developers who have attended a bootcamp also have some other kind of programming-related education.
Unsurprisingly, developers with a PhD have the highest average salary. Furthermore, at least in the United States, PhD holders get a nice salary bump after attending a bootcamp. But for every other education level, there is virtually no difference in salary between developers who have and who haven’t attended a bootcamp. Even worse for bootcamps, developers who have only attended a bootcamp make less on average than developers who are completely self-taught. Taking all of this into account, coding bootcamps seem to have a negligible effect on salary.
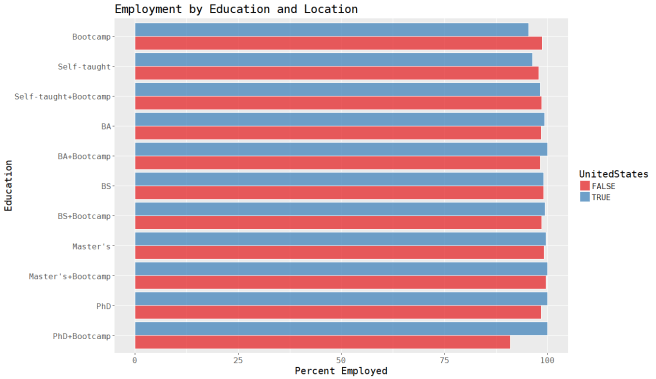
So what about employment?
Overall, unemployment among developers in this data set is only 1.26%, and the graph shows that it doesn’t seem to vary much by education level. The main takeaway seems to be that it’s actually difficult for a developer to not be employed (or that employed developers were more likely to take the survey). Regardless, the results for employment are much the same as those for salary. Attending a coding bootcamp has no appreciable effect.
Caveats!
There are a few. First, these graphs only show comparisons of averages, which don’t control for important variables like age, gender, and experience. Also, even though Stack Overflow is the most popular online community of software developers, the respondents to the survey are not representative of all developers. For example, a 2016 survey of coding bootcamp alumni conducted by Course Report found that 12% had professional programming experience before the bootcamp. However, the 2017 Stack Overflow Devloper Survey found that 46% of alumni were already employed as developers before the program. So Stack Overflow seems to have an overrepresentation of career software developers, while coding bootcamp alumni as a whole tend to be career changers.
Consequently, these results suggest that for developers who are looking for a salary or employability bump, attending a coding bootcamp may not be the best option. At the same time, bootcamps may still be worthwhile for people who are making a significant career change by entering the software industry.